As September rolls around, home buyers usually see a decrease in new homes on the market. Not this September – Pasadena’s real estate inventory is as strong as it was during the summer months. Pasadena home inventory increased for Single Family Homes (SFR), Condos and Townhomes – across the board. Absorption rate is going up as well which means that these Pasadena home listings will take longer to sell than before.
Pasadena SFR sales sold close to asking price at an average of 96.62%. 25 out of 59 home sales sold at full price or over asking.
The lowest priced closed SFR sale was for $230,000 at 816 Lincoln Avenue.
The highest priced closed SFR sale closed at $2,950,000. This Pasadena luxury home was at 1805 Kinneloa Mesa Road.
Looking at the Pasadena condominium statistics below, you will notice that the price per square foot of homes sold increased from $397 to $445. The driving force behind this increase is the multiple sales of condos in the new condominium project at 217 S. Marengo in Pasadena. Pasadena home shoppers want newly built homes and are willing to pay for them.
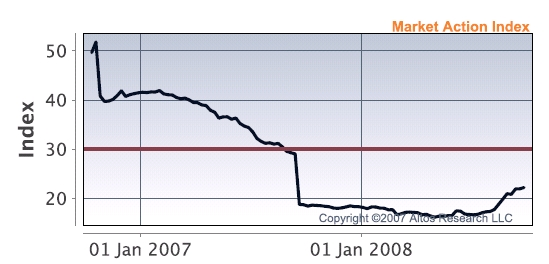
The Market Action Index indicator has remained relatively flat not providing strong indicators for real estate market conditions.
Housing Market Statistics for Pasadena – June 2008 through September 2008:
| Single Family Residence | Jun-08 | Jul-08 | Aug-08 | Sep-08 |
| New Listings | 77 | 140 | 80 | 78 |
| Total Listings | 388 | 390 | 325 | 341 |
| Sales Pending | 54 | 66 | 43 | 95 |
| Homes Sold | 54 | 65 | 69 | 59 |
| Listings Expired | 48 | 42 | 36 | 59 |
| Average Days on the Market | 121 | 104 | 133 | 115 |
| Average Price Per Sq. Ft. | $445 | $417 | $407 | $396 |
| Average Selling Price | $968,727 | $807,139 | $923,986 | $751,228 |
| Absorption Rate (# of weeks to sell current inventory at present rate of sales) | 31.1 | 26.0 | 20.4 | 25.0 |
| Condos | Jun-08 | Jul-08 | Aug-08 | Sep-08 |
| New Listings | 52 | 41 | 31 | 46 |
| Total Listings | 182 | 169 | 136 | 156 |
| Sales Pending | 30 | 25 | 9 | 38 |
| Homes Sold | 24 | 29 | 27 | 21 |
| Listings Expired | 34 | 17 | 22 | 35 |
| Average Days on the Market | 126 | 92 | 115 | 121 |
| Average Price Per Sq. Ft. | $391 | $386 | $397 | $445 |
| Average Selling Price | $503,451 | $515,788 | $515,896 | $459,540 |
| Absorption Rate (# of weeks to sell current inventory at present rate of sales) | 32.9 | 25.3 | 21.8 | 32.2 |
| Townhomes | Jun-08 | Jul-08 | Aug-08 | Sep-08 |
| New Listings | 36 | 21 | 11 | 16 |
| Total Listings | 90 | 81 | 57 | 69 |
| Sales Pending | 9 | 15 | 6 | 18 |
| Homes Sold | 11 | 10 | 13 | 15 |
| Listings Expired | 7 | 9 | 4 | 12 |
| Average Days on the Market | 102 | 84 | 111 | 130 |
| Average Price Per Sq. Ft. | $391 | $374 | $385 | $358 |
| Average Selling Price | $ 555,236 | $ 695,800 | $ 597,477 | $ 512,933 |
| Absorption Rate (# of weeks to sell current inventory at present rate of sales) | 35.5 | 35.1 | 19.0 | 19.9 |
SEARCH PASADENA CA HOMES FOR SALE (Single Family Residences – SFR)
SEARCH PASADENA CONDOS AND TOWNHOMES FOR SALE
Data compiled from ITEC (Pasadena Foothill Association Multiple Listing Service).
If you are interested in receiving a weekly Pasadena real estate market report with the Market Price Index, you can request the Pasadena Market Real Estate Report here and it will be emailed to you automatically each Monday. This is a report that I order specifically for the readers of my website from Altos Research who specializes specifically in real estate housing market activity throughout the country.
